
Don’t have access to qualitative data analysis software? This week’s blog post provides some tips on how to prepare your transcripts to work within Microsoft Excel or Google Sheets.
***
By Dustin De Felice and Valerie Janesick
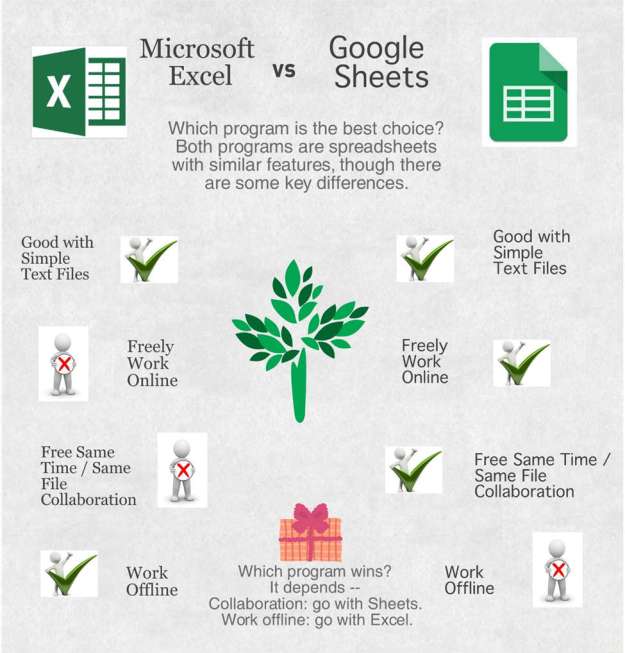
Are you in the middle of a research project? Or are you just starting and thinking about the possible tools you may need during analysis? Given the variety of choices out there, we discuss one choice not often thought of in qualitative research: spreadsheets. While there are a number of spreadsheet programs or Apps available, we focus on the steps needed to prepare your files for these two: MS Excel and Google Sheets. Either of these spreadsheets are good options, though each one has its own advantages (view our handout for a visual overview). In De Felice and Janesick (2015), we outline steps to take with Excel. For this discussion, we focus on preparing your transcripts so that they are ready to be imported into a spreadsheet. We recommend starting with the technique described by Meyer and Avery (2009). They provide an effective and simple technique for importing transcription files into Excel (version 2003). They recommend using Excel because it handles large amounts of data (numeric and text). It provides the researcher with ways of adding multiple attributes during the analysis process. Lastly, it allows for a variety of display techniques that include various ways of filtering, organizing and sorting.
In De Felice and Janesick, (2015), we recommend using Excel because the format mirrors many phenomenological methods (Giorgi, 2009; Moustakas, 1994). In addition, spreadsheet programs are powerful, yet not as overwhelming as other data analysis tools. In De Felice and Janesick (forthcoming), we extend our recommendation beyond just the use of Excel because there are a number of features available when utilizing Google Sheets. One benefit of Sheets is that it is widely available and most features are free. It allows for collaborative opportunities (including same time/same sheet editing). This feature is available within Excel, but there are a number of barriers that can limit this functionality (e.g. cost, different versions, etc.). If you are in the process of choosing between Excel and Sheets, we encourage you to read this blog post. In general, we recommend either spreadsheet for most projects, though there are some compelling reasons to use one over the other.
In terms of design, we recommend asking yourself this question before transcribing: “What unit do you have in mind when you think about your analysis?” (and Mayer & Avery, 2009). The answer to this question can help you decide how to best use either program. For example, will you use the turns in a conversation as a unit of measure, or will you use the phrase or sentence level as a unit? Of course, there are other ways to analyze the data, so we recommend starting with Meyer and Avery and their discussion on the “codable unit” (2009, p. 95-96). Before describing some of our steps, we would like to note that these steps are most effective for a researcher conducting and transcribing interviews (from audio).
Once you have identified that codable unit, you need to establish some conventions within your transcriptions to ensure your work will import. In Excel and Sheets, you can use these as separator characters: Tabs, Commas or Custom (essentially any single symbol including a hard tab as shown in figure 1). These separator characters will dictate how your text will fit into the cells and across the rows and down the columns. While there are ways of changing these separator characters, it is best to establish a convention within your transcriptions and stick with it throughout your research project.
Figure 1: Screenshot of the options available for importing a file into Google Sheets.

This import step is necessary because spreadsheets are not the easiest tools to use when transcribing. Instead we recommend using a word processor to create your transcripts in a text (.txt) format. In figure 2, we provide a screenshot from within a word processor. In the background of the screenshot, we have an example transcription that used a turn in conversation as the codable unit and the colon as a separator character.
Figure 2: Screenshot of Google docs file that we downloaded as plain text (.txt).

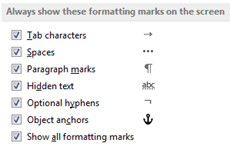
We have used different word processors and our preference for working with transcriptions is to use MS Word. We provide detailed steps in De Felice and Janesick (2015) on p. 1585. Our main reason for this choice is that there is no way to show formatting marks in Google Docs (see Figure 3 for a list of formatting marks available in MS Word. These features are not visible in Google Docs). These formatting marks are essential in properly preparing the transcription for importation. There is hope for an eventual add-on to correct this oversight in Google Docs, but there is currently no workaround.
Figure 3: Screenshot of formatting marks within MS Word.
Once your text file is ready for import, you can use the spreadsheet as an analysis tool. For phenomenological studies, we outline a few ways of using Excel in this capacity in De Felice and Janesick (2015). However, we recommend throughout your research project that you keep in mind this fantastic advice from Meyer and Avery: “All research projects (and researchers) are not the same. What works for one project may not be best for another.” (2009, p. 92) We offer the same advice for our suggestions here.
References
De Felice, D., & Janesick, V. J. (2015). Understanding the marriage of technology and phenomenological research: From design to analysis. The Qualitative Report, 20(10), 1576-1593. Retrieved from http://nsuworks.nova.edu/tqr/vol20/iss10/3
Giorgi, A. (2009). The descriptive phenomenological method in psychology. A modified Husserlian approach. Pittsburgh, PA: Duquesne University Press.
Meyer, D. Z., & Avery, L. M. (2009). Excel as a qualitative data analysis tool. Field Methods, 21, 91-112. DOI: 10.1177/1525822X08323985
Moustakas, C. (1994). Phenomenological research methods. Thousand Oaks, CA: Sage.

Aha ! Thank you I have been looking for stuff on using Google Sheets to help with Phenomenographical data analysis and came across your blog ! Thank you for this 🙂
LikeLike